zPlot - A ROOT Extension
December 19, 2016 - C++In the world of particle physics, the standard C++ program we use to do almost all of our analyses and plotting is called ROOT and is produced and maintained by CERN. I've heard many criticisms of this program over the years from both professionals and young researchers alike, but I've always found it to be a fairly nice program for analyses. It's a nice medium for implementing Tuple like objects, manipulating correlated data points, making histograms, and generally making legible and exacting plots. However, there are a few things that I've always found a bit annoying about ROOT and so I set out to make a little add-on class that could help clean up these annoyances and streamline my workflow.
First let's list some of the annoyances:
- Each histogram is an object that can be manipulated. This is lovely, but there is no built in "make it look nice" function, so I have to re-write that in each program.
- Creating an output ROOT file with the histograms I want is difficult. I have to track down each histogram's variable name, make sure it's available in the "writeOutput" functions and then manually "histogram->Write()" for each.
- Creating a PDF with a bunch of histograms as images suffers from the same output problem.
- Creating multiple output files for different purposes requires tracking the histograms twice.
- Saving a huge group of plots to a folder as image files is cumbersome and requires manually naming each file as it's saved, or coming up with some convention for using a built in histogram attribute for file naming.
- There should be a set of pre-made generic functions for making a plot look nice. It must still be possible to change the properties of the plot beyond that.
- There should be a single function that I can call that will output all 'managed' plots to a PDF. The same for saving all plots as images in a folder.
- It should be possible to have two different sets of managed plots (e.g. PlotsFromData and PlotsFromSimulation) in the same code.
- The management cannot interfere with any of the valuable assets of histogram objects.
- The managed histograms must still be iterable, like an array of histograms
zPlot* zP = new zPlot("Analysis Test","testFile");
zP->addTH1("test","Random Test;x;y",1000,-1,1);
zP->fillTH1("test",gRandom->Gaus());
zP->getTH1("test")->Fit("gaus");
zP->plotTH1("test","can",1);
zP->addTH1("test","Random Test;x;y",1000,-1,1);
zP->fillTH1("test",gRandom->Gaus());
zP->getTH1("test")->Fit("gaus");
zP->plotTH1("test","can",1);
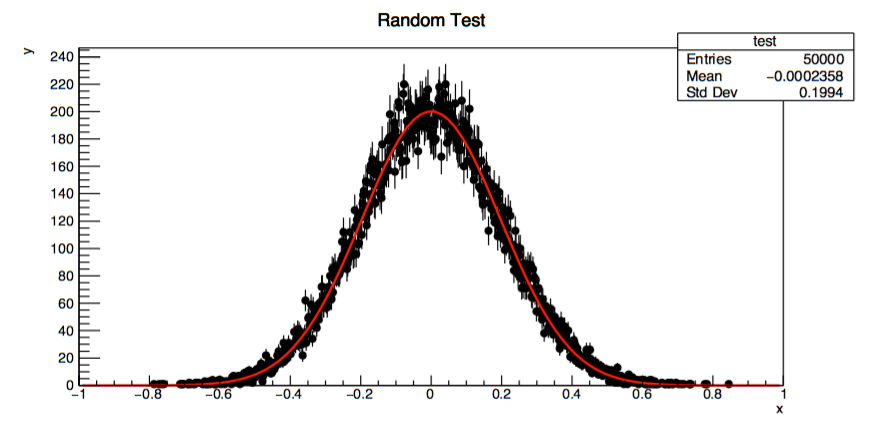
In this example, we instantiate the zPlot class, then we add a "TH1" object, which is ROOT speak for "1-Dimensional Histogram." All the data in the constructor specifies information about the histogram: name, title, size, and axis range. Then we add data to the histogram using a random number generator (in ROOT speak, you "fill" the histogram with data). Then we "get" the histogram and attempt to fit a Gaussian model to it. All of this is entirely based on the name of the histogram (i.e. test), which is used as the gateway to access the correct histogram object. Already, we see that the main actions one needs to be able complete with a histogram are available in the class: we can create, fill, access after filling, and plot. The plot is shown below.

for(int k=0; k<3; k++){
zP->addTH1(Form("efficiency_%i",k),"title;x;y",10,0,1);
zP->fillTH1(Form("efficiency_%i",k),(float)k/10.);
}
zP->addTH1(Form("efficiency_%i",k),"title;x;y",10,0,1);
zP->fillTH1(Form("efficiency_%i",k),(float)k/10.);
}
Here we've used the "Form" method to select a different name each time, just like if we had used an array called efficiency[k]. However, these plots are still stored in the zPlot class and have access to all the goodies that class has. This is one of the cases where we sacrifice some extra-typing for the purposes of overall readability.
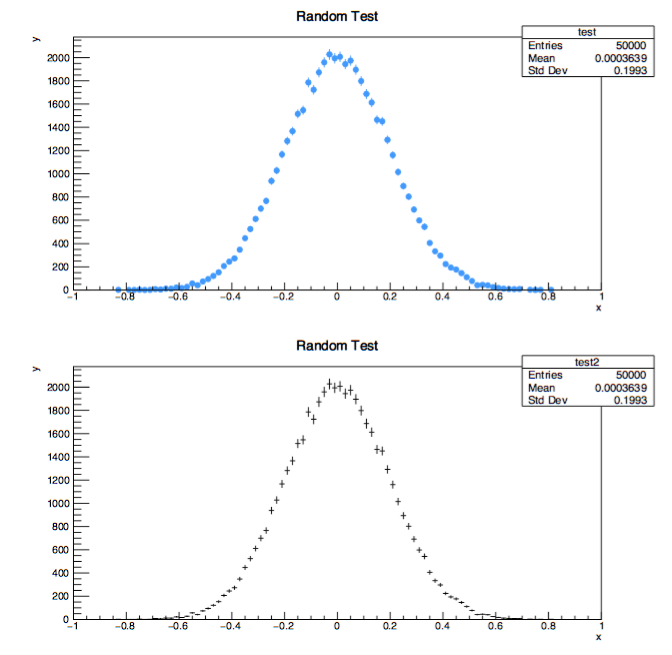
There are two other main features that we want to have within the class: output control and shared functions for making the plots look nice. To make the plots look nice, I have a function called "pretty1Dhist" (or "pretty2Dhist" or ...). This function is automatically applied to all newly created histograms and applies some base manipulations to make the plots look prettier and more legible. A head-to-head comparison of a modified plot with a standard plot is shown below, the modified plot on top.

Finally, we want to be able to quickly control the output to files. This is done with three functions: makePDF() and saveAllHists() for making image only outputs, and saveAllToFile() for saving in a ROOT accessible format. One of the details I've sort of skirted over is that ROOT doesn't directly draw all of it's plotting objects, each object must be placed on a "canvas" for drawing purposes. zPlot already has that functionality handled by also containing a vector for canvases using the same "name look-up" convention established for plot objects. makePDF grabs all of these canvases in the order they were added to the "canvas vector" and then adds them to a PDF, along with a cover page that has the title associated with the zPlot object. As such, if I created two zPlot objects in one analysis, one with zPlot* zP = new zPlot("From Data","from_data") and one with zPlot* zP2 = new zPlot("From Simulations", "from_simulation"), I could create two different PDFs. One would be called from_data.pdf and it's title page would say "From Data." The other would be called "from_simulaton.pdf" and the title page would say "From Simulation." Each one would only plot the canvases associated with the zPlot manager object. If I use "saveAllHistograms()" a folder will be created that is called "from_data" (or otherwise) and each plot associated with that object will be converted into a gif and saved in that folder. A sample PDF can be found here and the code used to make it (which is run inside the ROOT framework) is here with comments and annotations. For saving plot objects to use in later codes, or to manipulate more later, saveAllToFile() creates a file in ".root" format that contains all of the created histograms and graphs with their current data and visual manipulations in tact.
A few more small details that didn't fit elsewhere. For those familiar with ROOT's architecture, the zPlot class can also handle all TGraph objects (those are the XY Scatter plot style). The class also has a few other helper functions that allow more advanced manipulation of plot objects, but in general the easiest way to handle more specific cases is to do getTH1("plotName")->AnyNormalFunctionThatAppliesToTH1Class() (or getTGraph("plotName")...). I've also added an option to all the drawing functions so that ROOT's normal plotting options can be easily passed to the plotting. Also, though not shown here, the zPlot class can also handle TH2 and TH3 objects (2D- and 3D-histograms respectively).
Overall, I've found this methodology much more conducive to my workflow. Having all the canvases and graphs managed separately so that all I need to do is say, "plotTH1("name","canvas")" is much more readable than: canvas->cd(); plotVariable->Draw("options") and is easier to debug. I also find it much more pleasant to just have a single "makePDF()" line at the end than to have to go through and list every canvas and add it to the PDF (which takes 2 lines each time). The class offers a lot of small improvements in convenience and readability at the expense of occasionally typing a few more characters in a single line. I've used this class for many analysis prototyping projects, and am hoping to soon implement it into a larger analysis as well.
