KMeans Color Compressor
March 18, 2017 - Python, Scikit LearnClustering is a really interesting topic within the world of machine learning. The goal of clustering is often to explore the data you have and to find out, "given all this data, what points within the data are similar to each other, such that they might be interpreted similarly." This project builds on that idea by looking at all the pixels within an image and saying, "okay, pixels X, Y, and Z all have colors that are all pretty similar, let's color them all exactly the same color."
The machinery of this little project is a clustering algorithm called Kmeans. I've written an introduction to the Kmeans algorithm (and the idea of clustering) here. If you aren't familiar with Kmeans, please see that first, as I'll assume you understand the basics of the algorithm from here on.
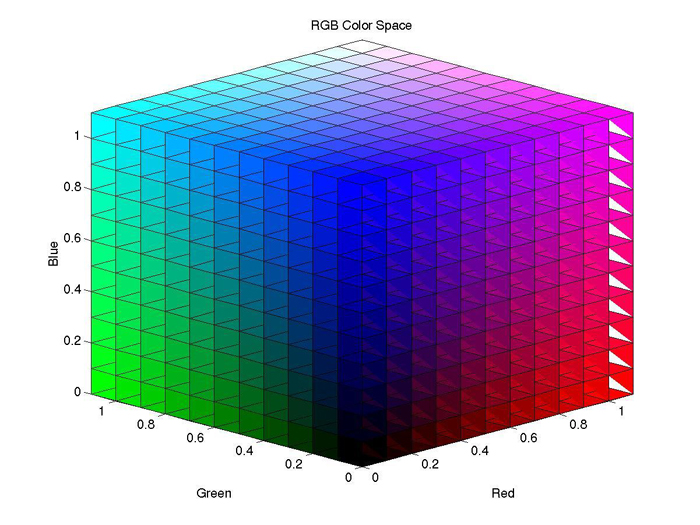
So let's talk about image manipulation. Images are really just a series of pixels stacked together, and each pixel has four defining pieces of information: how much red, how much blue, how much green, and how transparent. In order to work with all the pixel values, we simply need to read each pixel into a table storing each of these information bits. Python has an excllent library called PILLOW, or the Python Image (manipulation) Library, which does most of the heavy lifting for us: it reads through the pixels and returns a list of pixel values. Each pixel value is in the form [R, G, B, Tr]. Once we have this, that's where the fun can begin. First, I project all of the pixel values into a three-dimensional vector space with an axis for Redness, Blueness, and Greenness. So we essentially have a "color" space where we can now interact with our data. A demo of what that color space looks like is shown below:

Kmeans is space agnostic... all it needs to know is what space to work in and how we want to compute the distance between points. So by defining RGBness on a scale of 0-255 for each color (the default for pixels), we already have a calculable space. We simply need to setup our algorithm. A very simple version of Kmeans that I wrote can be found here, though it has not been designed for working with images in this form. This implementation makes a class for clusters and simply cycles through the data assigning points to the various cluster objects as decided by the distance. It's effective, but severely under-optimized for speed. However, I think it's an instructive read through if you're wondering about how a clustering algorithm can be simply designed.
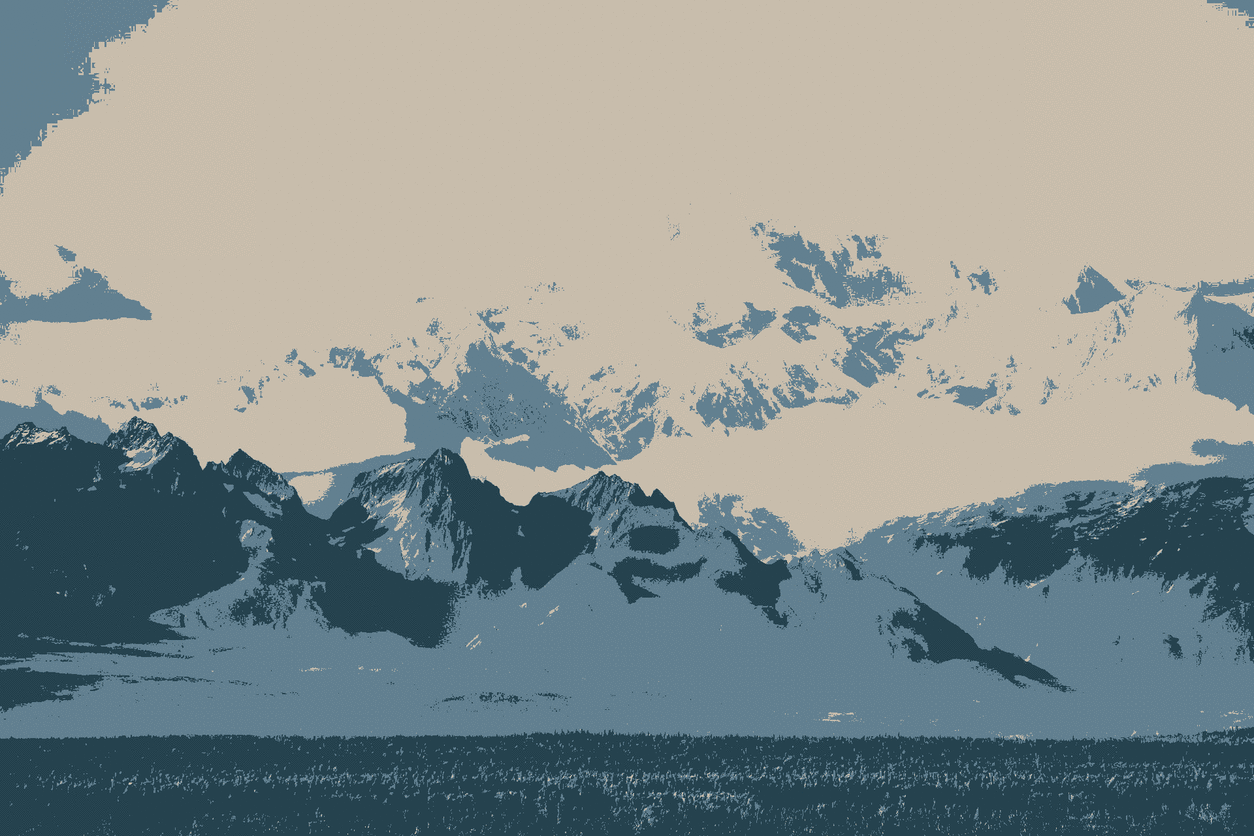
In practice, I used the pre-built Kmeans algorithm provided by Scikit-Learn. This is an optimized algorithm that runs really quickly and has a lot of nice features. I initialized it with Kmeans++, then fed it my color space data and let it go to town finding clusters. At the end, I computed the mean value of all the points in a color cluster, giving me the average RGB value for each cluster. Then I re-colored every point in the cluster with that average value, and redrew the picture with this new "flattened" color scheme. PILLOW once again does a lot of the heavy lifting for redrawing the image. Let me show you an example:
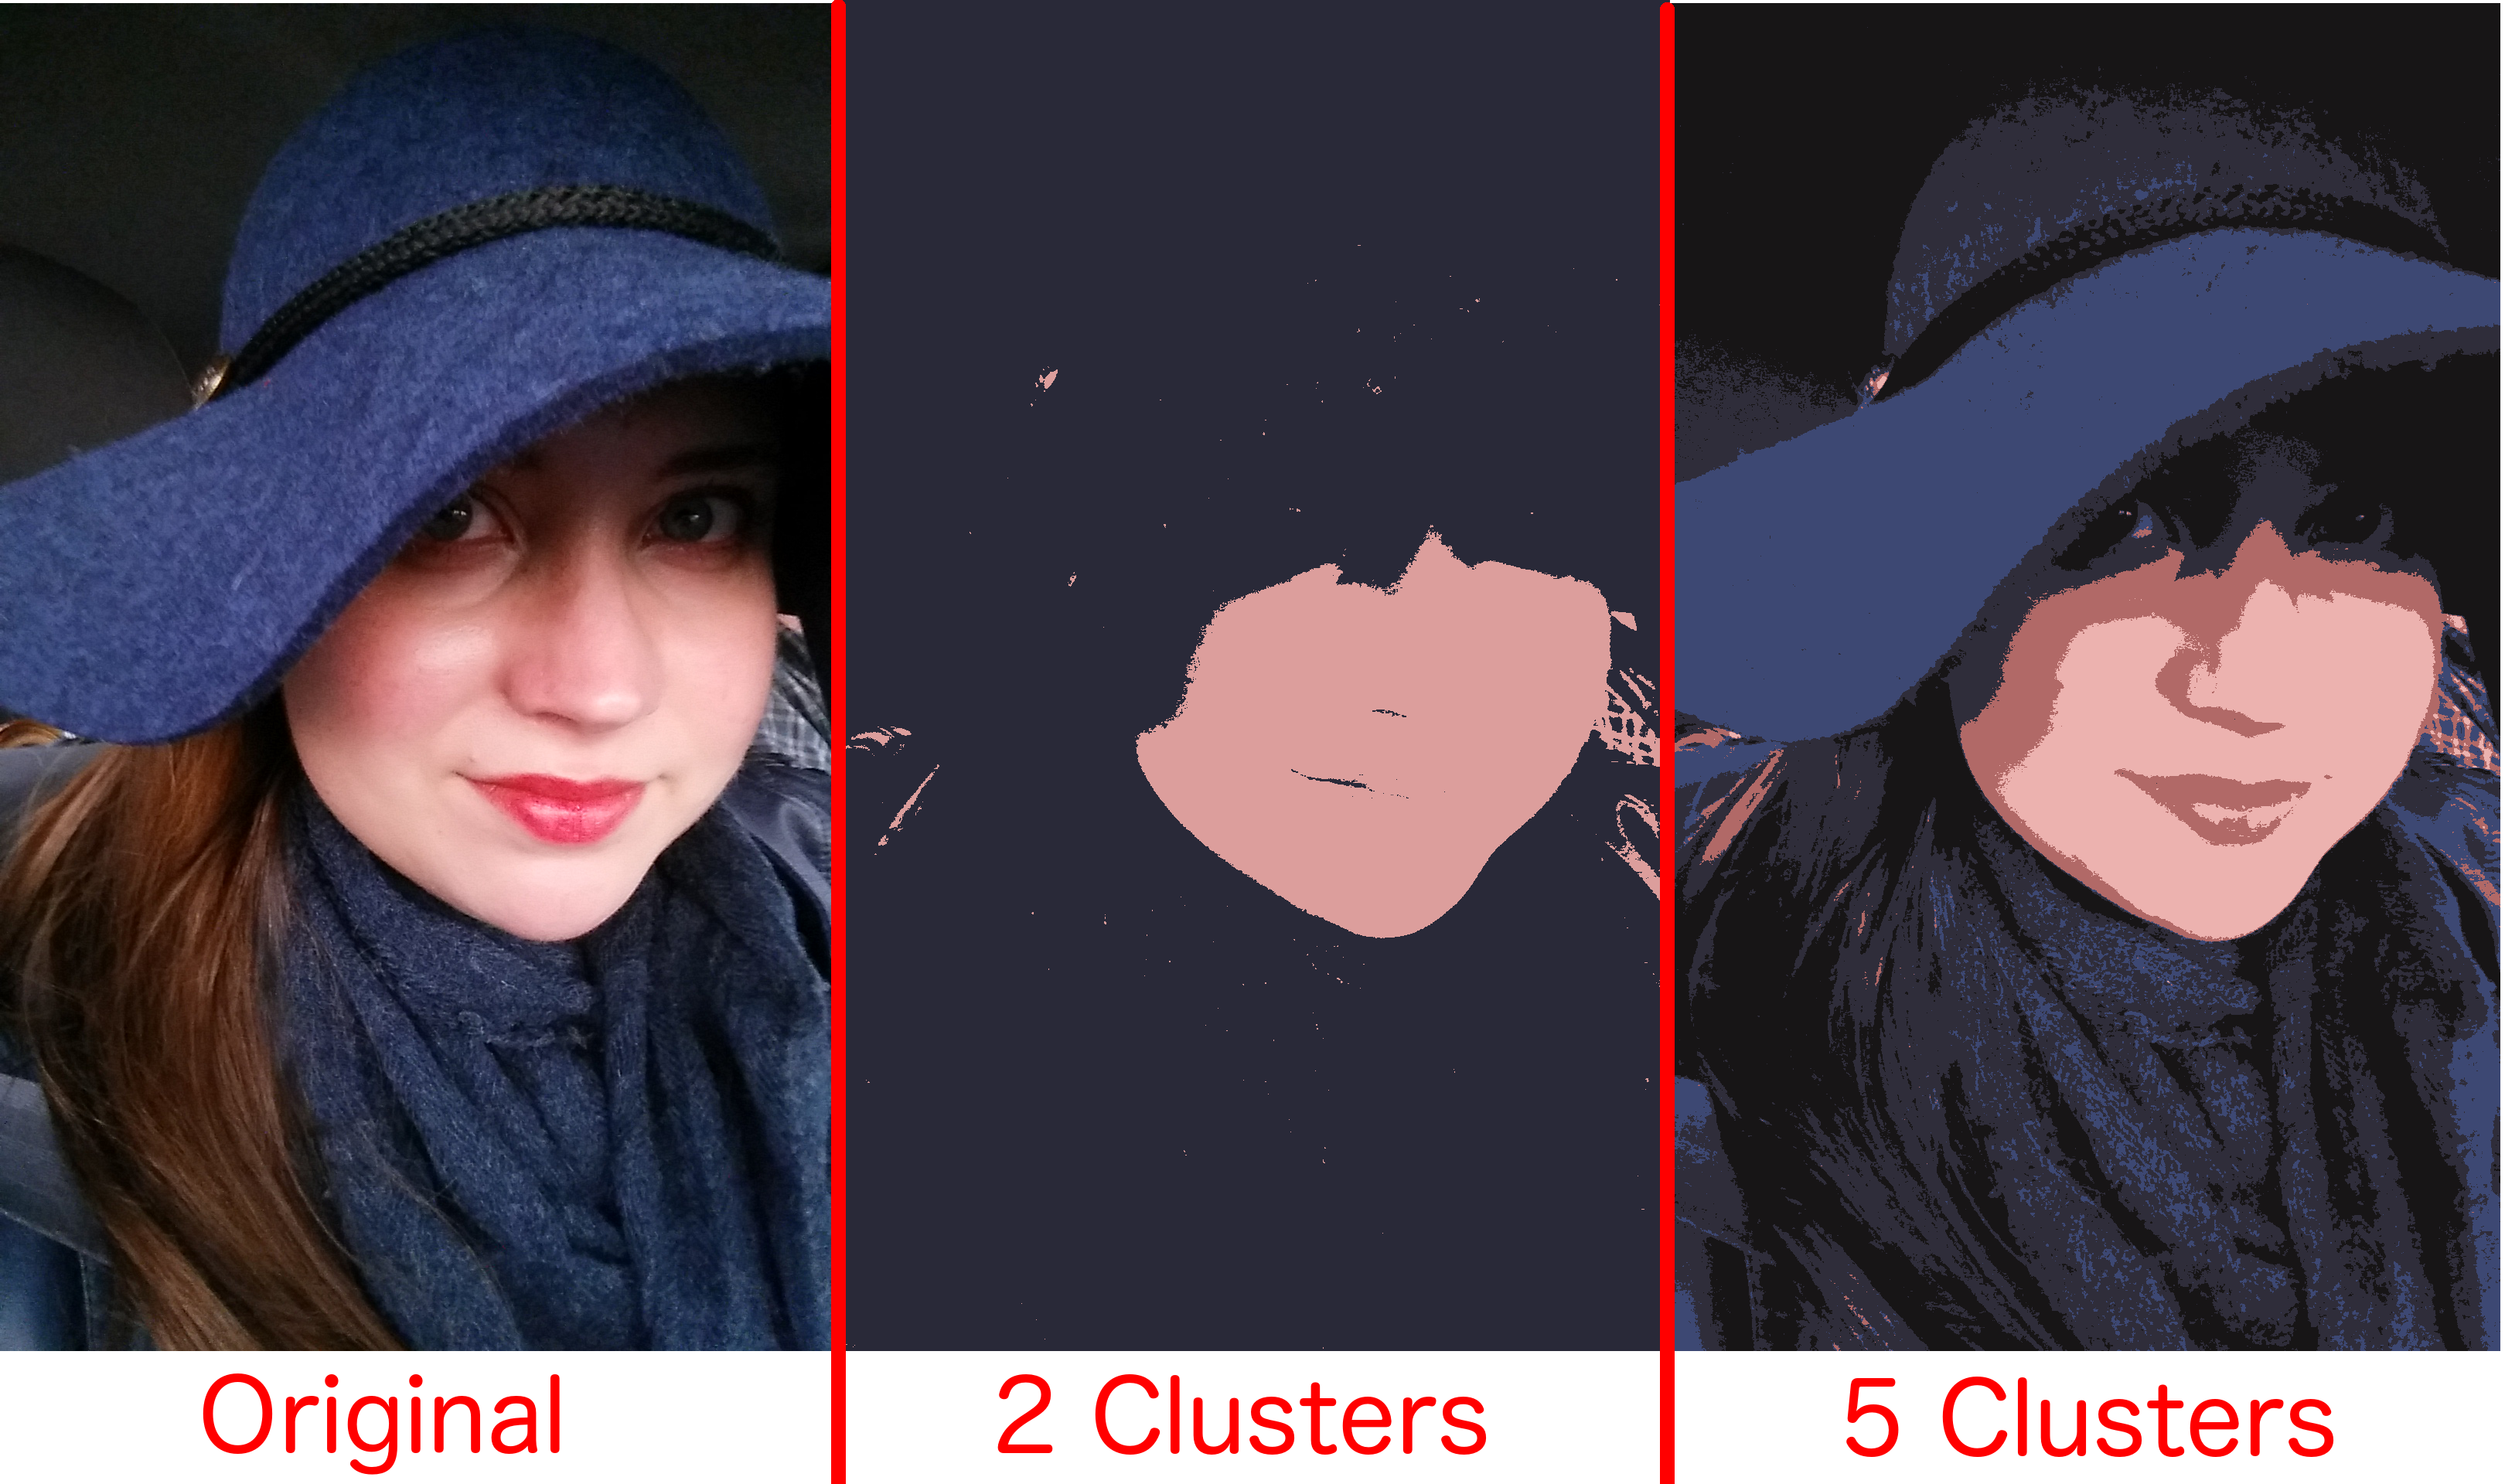
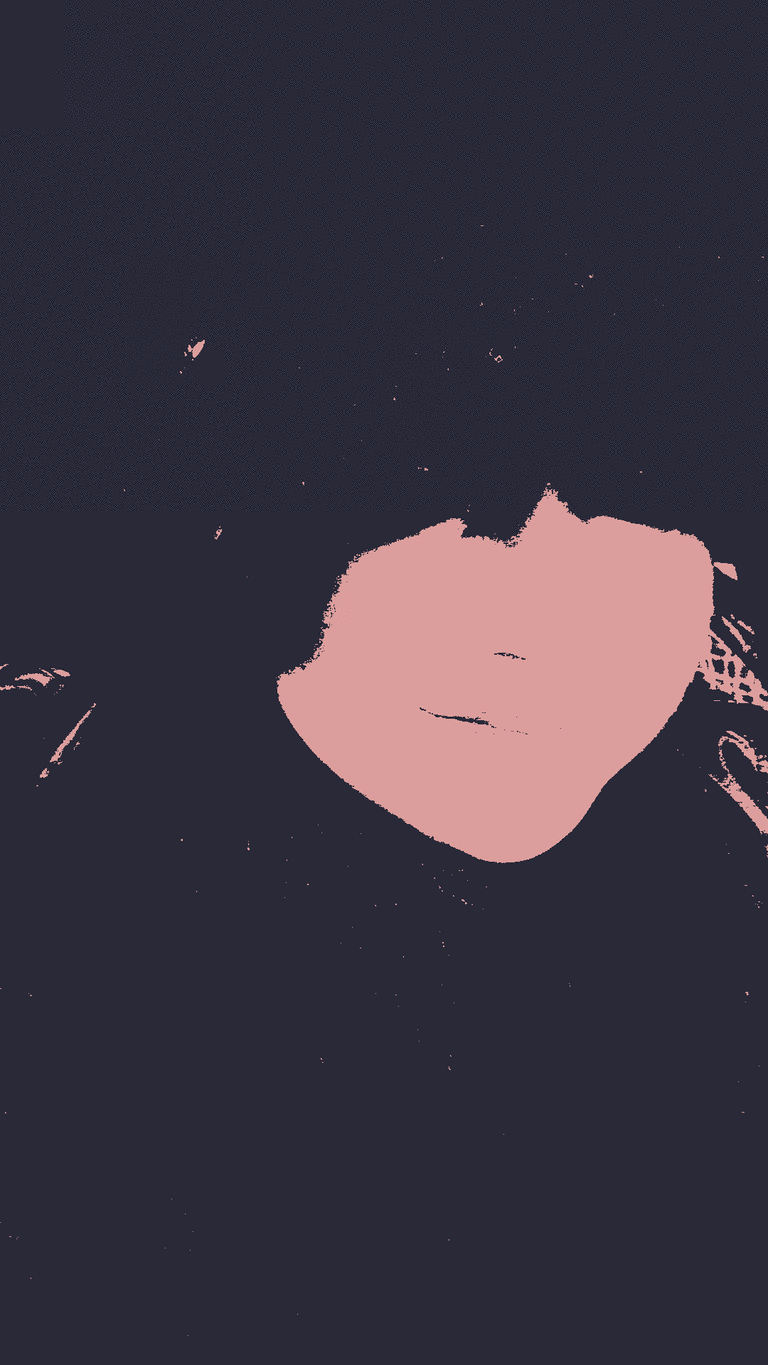
The original version of this image has over 100,000 uniquely colored pixels in it. In the right two images, we've found clusters for all the pixels and assigned each pixel the average color of its cluster; so there are only 2 and 5 total unique colors, respectively. In this project, the choice of k (number of clusters) is governed by artistic license, since there isn't really a "correct" way to colorize the image, so I've put together a gif cycling through choices of k from 2-15, ending with the original picture for comparison.
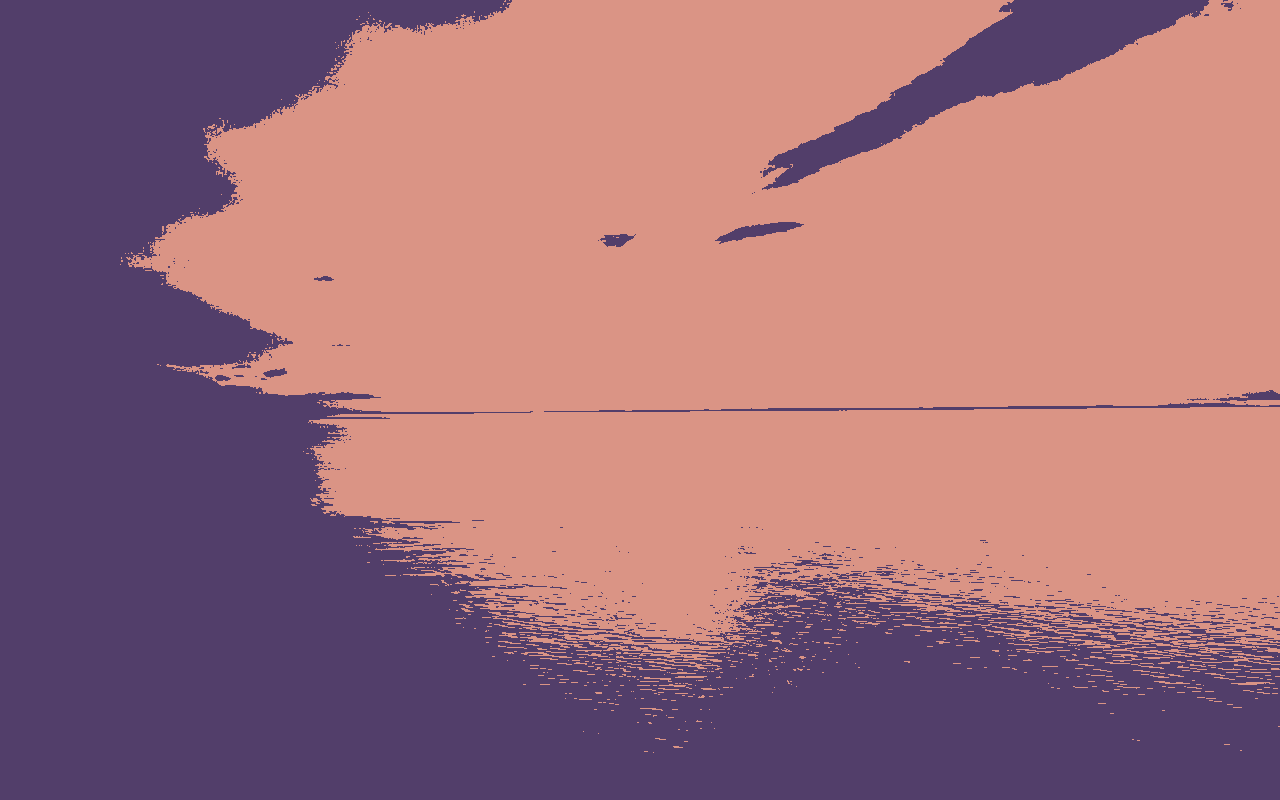
One of the beautiful things is I've designed this script to be totally image independent. Simply feed it an image, it will do all of the determination of how to get the RGB (there are several "types" of images that encode things a bit differently such as JPG, PNG, etc), then create the vector space and analyze it. On top of that, I've put together a handy little BASH script that will run the code over-and-over with different values for number of clusters. Some other sample images are shown below.

All of the code for this project can be found here: Image Flattener in Python. The final version is called imageFlattener_sklearn.py, but there is also a version using my write-up of Kmeans that can also work (so you can see how the algorithm works in a more mechanical way). It's a bit slower and less polished than the final version I used.